Joel Harris

Busting the "Fall Slump" Myth: Why Port Aransas Doesn't Actually Slow Down After Summer

alt tag

If August felt slow, you weren't imagining it. But the first few days of September already look different — and so does the last two years of fall data. 

What Happened Last Month - August 2026

August was the softest month of the year, and the softest August in six years.

  • Only 19% of listings that changed status actually sold. Of 130 listings, just 25 closed. 21 were withdrawn. 40 expired.
  • Homes took a median of 158 days to sell — the slowest August since 2021, when it was 70.
  • The median sale price fell to $485,000 — the lowest August price since 2021, down 18.5% from last August.
  • Inventory sits at roughly 31 months of supply. A balanced market is 5-6 months.

August 2026 was the weakest month of the year so far. If it felt discouraging, the numbers back that up.

Why the First Few Days of September Are Remarkable

Early September already looks better than August.

  • Sales closed at 88.8% of asking price, better than August's 87.0%.
  • Some of that early activity is sellers withdrawing stale summer listings — a healthier sign than a slow bleed. It looks like the market resetting, not stalling.
  • If the early pace held all month, September would land near 40 sales — a real step up from August's 25.

Six days isn't a trend yet. But every early signal points up.

The Myth: "Nothing Sells After Summer"

I keep hearing this from full-time residents, buyers, and sellers alike — that once Labor Day passes, the market goes quiet until spring. The data says that's just not true.

2024: Fall (Sep-Dec) averaged 29.8 sales/monthhigher than summer's 25.0. October ran 48% above summer. December ran 60% above it.

2025: Fall averaged 32.5/month vs. summer's 40.7 — a minor dip. September, October, and December were all within 4-14% of summer. Only November was genuinely weak both years.

The real story: fall matches summer closely, except for a specific November lull. That's a very different picture than "the season is over."

To Sellers: September Is Signaling a Strong Fall — Don't Sit This One Out

If you've been tempted to pull your listing and wait for spring, the data doesn't support that.

September has already priced better than August did all month, and fall historically holds up close to summer. Buyers with year-end motivations — 1031 deadlines, tax planning, holiday timing — are genuinely active right now.

Waiting for spring isn't the safe bet it sounds like, either — supply going into spring hasn't been any lighter than fall the last two years. If your listing has been sitting, a real price reset now beats a withdrawal or a timid nudge.

To Buyers: This Is Your Market

If you've been waiting for the right moment, this is close to it.

Supply is deeply oversupplied at ~31 months. Prices are down double digits year-over-year. Sellers are averaging high-80s percent of ask — real room to negotiate, especially with anyone who's been sitting since summer.

And because most people still believe the "nothing sells after summer" myth, buyer competition tends to thin out right now — even though sellers are still closing deals. Real inventory, real price flexibility, lighter competition than the calendar suggests. That's a good combination.

To Everyone: Check Out my Incredible Listings!

I'd be doing you a disservice if I pulled this analysis and didn't turn the same lens on my own inventory. Here's how five of my active listings stack up — and which ones I'd point any value-minded buyer toward.

Best buy #1 — 210 Social Circle #9-107, Cinnamon Shore. Just repriced to $1,395,000 for 2,587 sqft, or $539/sqft — nearly 23% below the Cinnamon Shore median. What makes this one special isn't just the price — it's only been on the market 88 days, actually faster than the typical Cinnamon Shore pace. This isn't a stale listing that finally got cheap enough; it's a well-priced property in the strongest submarket in the zip code that simply hasn't been snatched up yet. 

Best buy #2 — 167 Spanish Dagger, Palmilla. $879,000 for 2,092 sqft, or $420/sqft — nearly 40% below the Palmilla median. Three near-identical comps on the same street have closed at or below $870,000, meaning this listing is already priced right in line with what's actually trading nearby — in a submarket where the broader median runs dramatically higher. Plus, this property is having it's best year in terms of STR rental income.

Best buy #3 — 500 Ocean View, Port Aransas (gulf-front). $2,495,000 for 4,513 sqft, or $553/sqft. Measured against the rest of the zip code this looks like a luxury number — but measured against its true peer group (Port Aransas' own $2.25M+ tier, which averages $795/sqft), it's priced below the competition. Direct gulf-front access - heck! practically right on the beach - at this basis is genuinely hard to find...anywhere.

264 Marina Dr, Island Moorings. $890,000 for 1,961 sqft, or $454/sqft — about 17% below the Island Moorings median. This corner-lot property has some cosmetic and maintenance items to address, which is exactly why the price reflects room to invest — a straightforward opportunity for a buyer willing to put in a little work for meaningful upside. Plus this is on-the-water living in Island Moorings - great access to the canal, to the flats, and straight out into the gulf.

301 E Avenue C #2, Port Aransas. $619,000 for 1,476 sqft, or $419/sqft — right in line with the Port Aransas median. The price isn't a steep-discount play, but the income story is: this property is having its best year yet, on pace for $55,000 already in gross rental income for 2026, and has outperformed the broader Port Aransas market in both occupancy and RevPAR every single month this year. For an investor weighing sticker price against actual return, this is a newer-build (2011), 4-bedroom, pool home that's already proving itself as a top-tier income producer.


Data reflects MLS activity for zip code 78373 (Port Aransas) through September 7, 2026.
Port Aransas Hidden Gems: The Properties Buyers Need to Know About Right Now

alt tag

Make no mistake — this is a buyer's market right now. We're coming off the back end of Port Aransas' typically heavier summer buying season, and the data shows real seller fatigue: days on market climbing, closings slowing for four straight months, and a growing number of listings that have been sitting long enough for sellers to be ready to talk. If you've been waiting for leverage, this is it.

If you're buying from out of town, you need someone on the ground who actually knows this market — and I'll make my own shameless plug here: beyond selling real estate, I also own and operate a vacation rental management company here in Port Aransas. That means I'm not just guessing at what a property could rent for — I'm actively managing bookings, pricing, and returns for real owners every day. I know what sells, what sits, how to get a property booked at the right rate, and how to deliver above-market returns for the properties I manage. That's the lens behind every pick on this list.

Not every good deal announces itself with a fresh price cut and a "motivated seller" banner. Some of the best opportunities in the 78373 right now are quietly sitting in plain sight — priced under what their own neighborhood typically commands, waiting far longer than similar homes nearby, in submarkets where that combination almost never lasts.

The method behind the list

Every submarket in Port Aransas has its own unique features. Cinnamon Shore and Palmilla are master planned Watercolor-esque STR resort communities that move fast and command a premium — homes there typically sell in the $680–$700 per square foot range and don't sit long. Island Moorings doesn't allow STRs, is situated on canals and runs a bit more affordable. General Port Aransas is more budget-friendly and slowest-moving of the bunch.

"Cheap" only means something relative to those benchmarks, and "stale" only means leverage when a property has been sitting longer than its own neighborhood typically allows. So I looked for properties that check both boxes at once: priced meaningfully below their submarket's median price per square foot, and sitting on the market well past their submarket's typical pace. That combination is rare — and when it shows up in a strong, in-demand neighborhood, it's usually a sign that a good property has simply been overlooked, not that something's wrong with it.

The standouts: strong submarkets & real value 

These are properties in Cinnamon Shore, Sunflower, and Island Moorings — submarkets that normally sell quickly and hold their price — priced below their own neighborhood's median and sitting well past the norm. In a market this competitive, that's the buyer's equivalent of finding money on the sidewalk.

  • 140 Bent Grass Dr, Cinnamon Shore — $1,075,000 for 1,882 sqft, or $571/sqft — 18% below the Cinnamon Shore median. It's been on the market 512 days, roughly five times the typical pace for this neighborhood. A Cinnamon Shore property priced under its own market and sitting this long is genuinely rare — worth a serious look before it gets discovered. It's not just a price story either: this property grossed over $80,000 in rental income in 2025 — strong, proven ROI for a buyer thinking beyond the purchase price.
  • 3700 Island Moorings Pkwy #16, Island Moorings — $975,000 for 2,603 sqft, $375/sqft — 31% below the Island Moorings median, 566 days on market.
  • 122 Bent Grass Dr, Cinnamon Shore — $1,550,000 for 2,997 sqft, $517/sqft — 26% below median, 201 days on market. This one comes with over $72,000 in validated rental income last year — real, documented performance, not a projection.
  • 125 Fish Hook Lane, Cinnamon Shore — $1,090,000 for 1,762 sqft, $619/sqft — 12% below median, 194 days on market. Also backed by real numbers: over $71,000 in validated rental income last year.
  • 705 Sunrise Ave, Sunflower — $1,265,000 for 2,076 sqft, $609/sqft, 201 days on market. Sunflower is a small enough submarket that there isn't much direct comp inventory to benchmark against — but the rental upside is well documented, with projected gross annual rental revenue of $65,000.

Port Aransas general: value plays for buyers who want more house for the money plus strong STR income

General Port Aransas is already the most affordable submarket in the zip code — so a property priced well below even that benchmark, and sitting significantly longer than typical, is a signal that the seller is ready to talk.

  • 515 W Avenue C — $639,900 for 2,001 sqft, $320/sqft — 24% below the Port Aransas median, 542 days on market.
  • 699 Morgan Cr #104 — $435,000 for 1,492 sqft, $292/sqft — 31% below median, 478 days on market. This one's worth a second look beyond the price alone: as the property manager for a comparable unit in this complex through Grand Welcome, I'm seeing close to $40,000 a year in gross rental income — real, current performance data on what this address can produce for the right investor, not a projection.
  • 178 Mustang Royale — $749,000 for 2,516 sqft, $298/sqft — 30% below median, 260 days on market.

Interested in these in Cinnamon Shore, Island Moorings, Palmilla and/or Port Aransas? Contact me and we can do the full ROI analysis on these to evaluate true earning potential.

Shameless plug: my own listings, and which ones are the best buys right now

I'd be doing you a disservice if I pulled this analysis and didn't turn the same lens on my own inventory. Here's how five of my active listings stack up — and which ones I'd point any value-minded buyer toward.

Best buy #1 — 210 Social Circle #9-107, Cinnamon Shore. Just repriced to $1,395,000 for 2,587 sqft, or $539/sqft — nearly 23% below the Cinnamon Shore median. What makes this one special isn't just the price — it's only been on the market 88 days, actually faster than the typical Cinnamon Shore pace. This isn't a stale listing that finally got cheap enough; it's a well-priced property in the strongest submarket in the zip code that simply hasn't been snatched up yet. 

Best buy #2 — 167 Spanish Dagger, Palmilla. $879,000 for 2,092 sqft, or $420/sqft — nearly 40% below the Palmilla median. Three near-identical comps on the same street have closed at or below $870,000, meaning this listing is already priced right in line with what's actually trading nearby — in a submarket where the broader median runs dramatically higher. Plus, this property is having it's best year in terms of STR rental income.

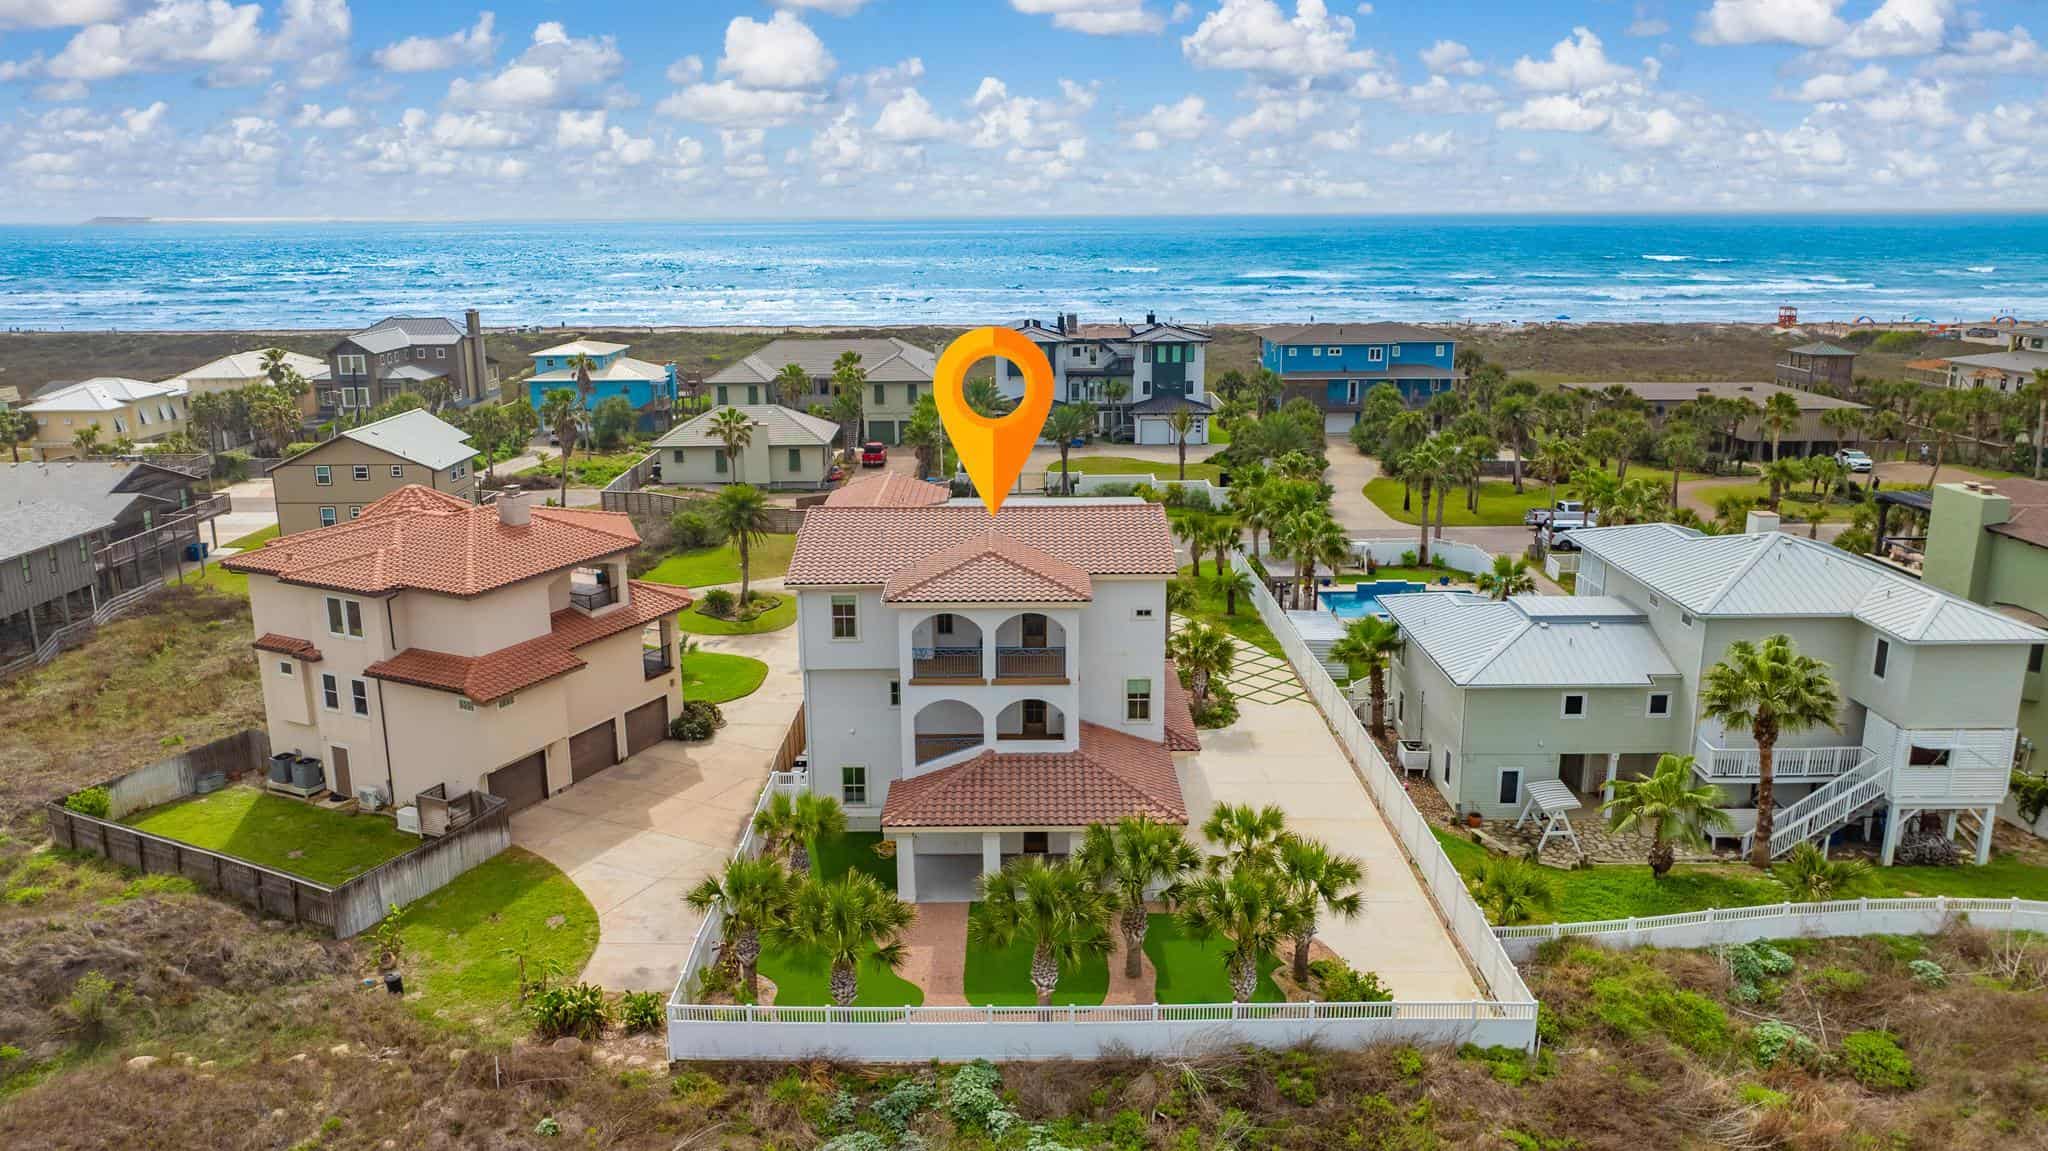
Best buy #3 — 500 Ocean View, Port Aransas (gulf-front). $2,495,000 for 4,513 sqft, or $553/sqft. Measured against the rest of the zip code this looks like a luxury number — but measured against its true peer group (Port Aransas' own $2.25M+ tier, which averages $795/sqft), it's priced below the competition. Direct gulf-front access - heck! practically right on the beach - at this basis is genuinely hard to find...anywhere.

264 Marina Dr, Island Moorings. $890,000 for 1,961 sqft, or $454/sqft — about 17% below the Island Moorings median. This corner-lot property has some cosmetic and maintenance items to address, which is exactly why the price reflects room to invest — a straightforward opportunity for a buyer willing to put in a little work for meaningful upside. Plus this is on-the-water living in Island Moorings - great access to the canal, to the flats, and straight out into the gulf.

301 E Avenue C #2, Port Aransas. $619,000 for 1,476 sqft, or $419/sqft — right in line with the Port Aransas median. The price isn't a steep-discount play, but the income story is: this property is having its best year yet, on pace for $55,000 already in gross rental income for 2026, and has outperformed the broader Port Aransas market in both occupancy and RevPAR every single month this year. For an investor weighing sticker price against actual return, this is a newer-build (2011), 4-bedroom, pool home that's already proving itself as a top-tier income producer.

One more thing: a unique opportunity for a bold investor

I couldn't leave this one out, even though it's not one of my own listings. A nearly finished 5-unit luxury townhome community in Port Aransas (on Ave A just around the corner from the Marina) has crossed my desk as a foreclosure-priced opportunity — priced at $3,100,000 against a recent appraisal of $4.56M. The package is 5 total units with 2 shared pools: three 4-bed/4-bath townhomes (1,680–1,778 sqft) with rooftop terraces, gulf views, and 2-car attached garages, plus two 1-bed/1-bath units (580 sqft) with private balconies and 1-car garages. It's roughly $55,000 of remaining work away from being fully rent-ready ahead of peak summer season.

The upside case is real: with short-term nightly rates reported up to $1,400 on the larger units and $400 on the smaller ones, several of these units carry the potential to gross $60,000+ each in annual rental income once complete — a genuinely rare find in a market this starved for new construction inventory.

Here's what makes this one time-sensitive: according to my source, the bank behind this deal wants an offer — any offer — and wants to move quickly, with room to potentially build a renovation budget into the deal itself. That's a real window for the right buyer to structure something creative.

I'm not the listing broker on this one, so every number here is unverified and needs independent due diligence. But I can connect you directly to the investor or broker on this opportunity and help facilitate the deal from there — reach out to me if you want the introduction.

Bottom line

The best deals in this market aren't always the ones with the biggest "price reduced" banner — sometimes they're the ones that never needed one, sitting quietly in a neighborhood buyers assume they can't afford to be patient in.

I'm working hard to make sure my listings are priced for today's market, not the illusions of yesteryear. Together, this is a must-see list of high-quality second homes and solid STR income producers. If any of these catch your eye, reach out and I'll pull full comps, condition details, income history, and get deep into evaluating true ROI. 

Port Aransas Market Pulse: The Opportunity Hiding in the First 20ish Days of August

alt tag

Every month leaves fingerprints in the MLS data — and August 2026 in the 78373 has left a distinctive set. Twenty-two homes closed, thirty-three came on the market, and a full seventy-six listings hit some kind of terminal status before the month was even two-thirds over. Look past the headline numbers, though, and this is a month with real openings for both buyers and sellers who know where to look.

First, what is a "fail rate"?

You'll see this term below, so let's define it plainly: fail rate is the share of listings that end without a sale.

Every listing eventually lands in one of three buckets — it sells, it gets withdrawn by the seller, or it expires at the end of its listing agreement without selling. Fail rate simply asks: of the listings that reached one of those endings, what percentage did not sell?

Fail rate = (Expired + Withdrawn) ÷ (Sold + Expired + Withdrawn)

Here's the reframe worth sitting with: a listing ending without a sale isn't dead inventory — it's a property about to get a second chance, often with a smarter price and fresher presentation the next time around. Every expiration and withdrawal this month is tomorrow's better-positioned relist.

August by the numbers — and the upside in each one

In the first 23 days of August, 78373 saw:

  • 33 new active listings — fresh inventory and fresh choices for buyers shopping right now
  • 26 properties go under contract — real demand is still very much alive
  • 22 closings — deals are getting done, not just discussed
  • 24 listings pulled to Temporarily Off Market — sellers pausing to regroup, not giving up
  • 12 withdrawals and 14 expirations — the market clearing out stale inventory, which sets up cleaner comps and better-calibrated pricing heading into fall

Sale-to-original-list-price ratio held steady at 88.8% on average — a strong number that shows this isn't a market in free-fall. Sellers who price thoughtfully are still getting close to their number. Buyers, meanwhile, are working with a noticeably deeper bench: median days on market for August closings sits at 181 days, up from July's 123-day median, which means more time, more options, and more room to negotiate than buyers had just a month ago.

Broken out by sub-neighborhood, Cinnamon Shore is the month's bright spot, closing at  the lowest - 25% fail rate — meaning three out of every four listings that reach a conclusion there are ending in a sale. That's a strong signal for anyone considering listing in Cinnamon Shore this fall.

Closed volume across 78373 has eased gently for four straight months — May (39) to June (38) to July (32) to an August pace of roughly 29 — but "gentle" is the operative word. This reads far more like a market slightly slowing than one that's stalling out.

>>Shameless plug for my Cinnamon Shore listing that is absolutely gorgeous: 210 Social Circle, Unit # 9-107. Three bedroom, strong STR income, right on the square, smack in the middle of all the action at Cinnamon Shore North. Click HERE for breathtaking video tour.<<

Notable sales: proof the right pricing strategy still wins

A few closings this month are worth calling out individually — each one is a real-world example of what's working.

Sold above original asking — 5497 State Highway 361 #36. This condo closed at 114.5% of its original list price ($594,000 against an original ask of roughly $519,000) after 259 days on market. It's a clear reminder that patient, well-positioned sellers can still land above their number — even in a market that's cooled overall.

Sold the fastest — 900 N Station St #A2 and 117 Center Lane. 900 N Station St #A2 closed in just 50 days at 95.2% of original list. 117 Center Lane moved even faster relative to price, closing in 60 days at 97% of original list for $1,625,000 — proof that well-priced luxury product is still moving briskly when it's positioned right.

Found their number  — 689 Morgan and 174 Spanish Dagger. These two eventually sold at 64.4% and 71.5% of original list, respectively — and that's genuinely good news for the buyers who landed them. For sellers, the lesson is straightforward and actionable: repositioning earlier, rather than waiting out the market, gets you to the same outcome faster and with less wear and tear on the listing.

Full price after real price discovery — 116 W Cotter Ave #H. This one sold at exactly 100% of its current list price ($750,000) after a thoughtful reset from its original number. It's the playbook in action: find the market's real number, and buyers show up ready to pay it.

What this means for you

If you're a seller: the data shows buyers are still transacting at close to 89 cents on the dollar, and a strong showing in Cinnamon Shore proves the right pricing strategy still gets rewarded quickly. If your listing has been sitting, this month's wave of expirations and withdrawals is a natural, low-friction moment to reposition alongside a market that's actively resetting expectations — not fighting against it.

If you're a buyer: this is a window worth taking seriously. Deeper inventory, longer average market time on closings, and a healthy number of freshly-repriced relists mean more room to negotiate than you've had all summer — without the frenzy that made spring and early summer feel so competitive. And when a property is priced right, like this month's fastest movers, it still won't wait around for you — so having a plan ready to act matters.

Either way, the throughline is the same: strategy is winning right now, more than raw market momentum. That's good news, because strategy is the one thing we can control together.

Data source: CCAR MLS, 78373, activity dated 8/1/26–8/23/26, compared against the comprehensive market pull from 8/5/26.

Port Aransas, Palmilla, or Cinnamon Shore: Where the Data Says to Buy Right Now

alt tag

 By Joel Harris, Tx Beach Luxury | Phyllis Browning Company

Port Aransas isn't one market — it's three or four smaller ones stitched together under a single zip code. Cinnamon Shore, Palmilla, Island Moorings, and general Port Aransas each trade at different price points, move at different speeds, and reward buyers in different ways. If you're comparing them side by side using list price alone, you're missing the story.

I pulled the full 78373 MLS dataset — every Active, Sold, Withdrawn, and Expired listing — and broke it down by neighborhood. Here's what the numbers actually show.

Value: Who's Commanding the Highest Price Per Square Foot

Ranked by average sold price per square foot — what buyers actually paid, not what sellers hoped for:

Neighborhood Sold Listings  Avg List $/SqFt    Avg Sold $/SqFt    Avg SP/OLP% 
Cinnamon Shore 16 $694.31 $662.34 94.4%
Palmilla 10 $561.92 $535.26 94.9%
Island Moorings 5 $518.71 $498.83 88.7%
Port Aransas (general) 152 $403.42 $383.64 88.2%


Cinnamon Shore sits in a class of its own — nearly double the general Port Aransas rate. Palmilla trails it by about $127/sqft but still clears general Port Aransas by a wide margin. That's the master-planned community premium: newer construction, deed restrictions, and amenity access all show up directly in price.

Speed: Who's Actually Selling Fast

Average days on market for closed sales tells a different story than list price does:

Neighborhood    Avg DOM (Sold)        # Sold     
Palmilla 81.4 10
Cinnamon Shore 131.0 16
Port Aransas (general) 157.4 152
Island Moorings 168.8 5


Palmilla is the standout here — homes that sell are moving in roughly half the time of the general Port Aransas market, and nearly 50 days faster than Cinnamon Shore. That's a meaningful liquidity signal: less time carrying a listing, less exposure to shifting rate environments, and a market that's actively absorbing inventory rather than sitting on it.

It's worth noting this cuts against the Active-listing DOM numbers, where Palmilla's currently-listed inventory is averaging 130.6 days on market — meaning the homes that do sell in Palmilla sell fast, but there's a longer tail of stale active inventory dragging the average up. That's a market with a clear "priced right vs. priced wrong" split.

Zooming in by Price Band

Breaking DOM down further by price tier (sold only) sharpens the picture:

  • $500K–$750K: Palmilla sells in 36.5 days vs. 92.7 in Cinnamon Shore and 166.4 in general Port Aransas — the widest gap of any band.
  • $750K–$1M: Palmilla averages 100.5 days, still faster than Cinnamon Shore (154) and roughly on par with general Port Aransas (109.6).
  • $1M–$1.5M: Palmilla drops to 56 days — the fastest of any neighborhood/band combination in the dataset.

Palmilla's speed advantage isn't a fluke of one or two quick sales skewing a small sample — it holds up across multiple price tiers.

Negotiating Room: Where Buyers Have Leverage

SP/OLP% (sold price as a percentage of original list price) tells you how much room sellers are actually conceding:

  • Port Aransas (general): 88.2% — sellers are accepting roughly 12% off original list, on average
  • Island Moorings: 88.7% — similar dynamic
  • Cinnamon Shore: 94.4% and Palmilla: 94.9% — sellers in both are holding firm within about 5% of ask

That's the trade-off: general Port Aransas gives buyers the most room to negotiate below list, but it's also the slowest-moving, lowest-$/sqft segment. Cinnamon Shore and Palmilla give sellers far more pricing power, but move faster and hold value better.

So Where Should You Buy?

There's no single right answer — it depends on what you're optimizing for — but here's how I'd frame it for different buyer profiles:

Best overall value-to-liquidity balance: Palmilla. You're paying a real premium over general Port Aransas ($535 vs. $384/sqft sold), but you're buying into the fastest-moving, most-liquid micro-market in the zip code — especially in the $500K–$1.5M range, where Palmilla homes are clearing in 36–100 days against a broader-market backdrop still averaging 150+ days. For a buyer thinking about resale timeline or exit flexibility, that liquidity is worth paying for.

Best for negotiating leverage / entry price: General Port Aransas. If your priority is landing the lowest basis and you're comfortable with a slower resale market, this is where sellers are conceding the most (88.2% SP/OLP) and where $/sqft is lowest. Just budget for a longer hold — sold DOM here runs 157 days on average, and roughly 220+ days for the sub-$500K segment specifically.

Best for long-term value retention: Cinnamon Shore. The highest sold $/sqft in the zip by a wide margin, plus strong SP/OLP (94.4%), signals a market that holds its value under negotiation. It moves slower than Palmilla, but for buyers prioritizing appreciation and prestige over speed, this is the deepest-pocketed, most established submarket in Port Aransas.

If I had to pick one segment as the current "best buy" on a pure numbers basis, it's Palmilla in the $500K–$1M range — the combination of sub-100-day sold DOM and $/sqft still meaningfully below Cinnamon Shore is the most efficient risk/reward setup in the 78373 dataset right now.


Data source: CCAR MLS pull, 78373, as of 8/5/2026. Figures reflect Active, Sold, Withdrawn, and Expired status classes; neighborhood classification via street-name mapping. Want the full breakdown for a specific address or building? Reach out — 210-872-4437 | jharris@phyllisbrowning.com.

Port Aransas Homes Are Selling Faster Than Last Summer

alt tag

We look forward to making this the best resource for information about real estate, our local area, and current topics that impact you. Please feel free to comment on our posts if you have questions or reactions to share. If there is anything you'd like to see us write about, we'd love to hear your ideas.


Port Aransas Homes Are Selling Faster Than Last Summer — Here's the Data

If you tried to sell a home in Port Aransas last summer, you remember the wait. If you're thinking about listing this year, here's the good news: the market has picked up the pace, and the numbers prove it.

The Headline Number

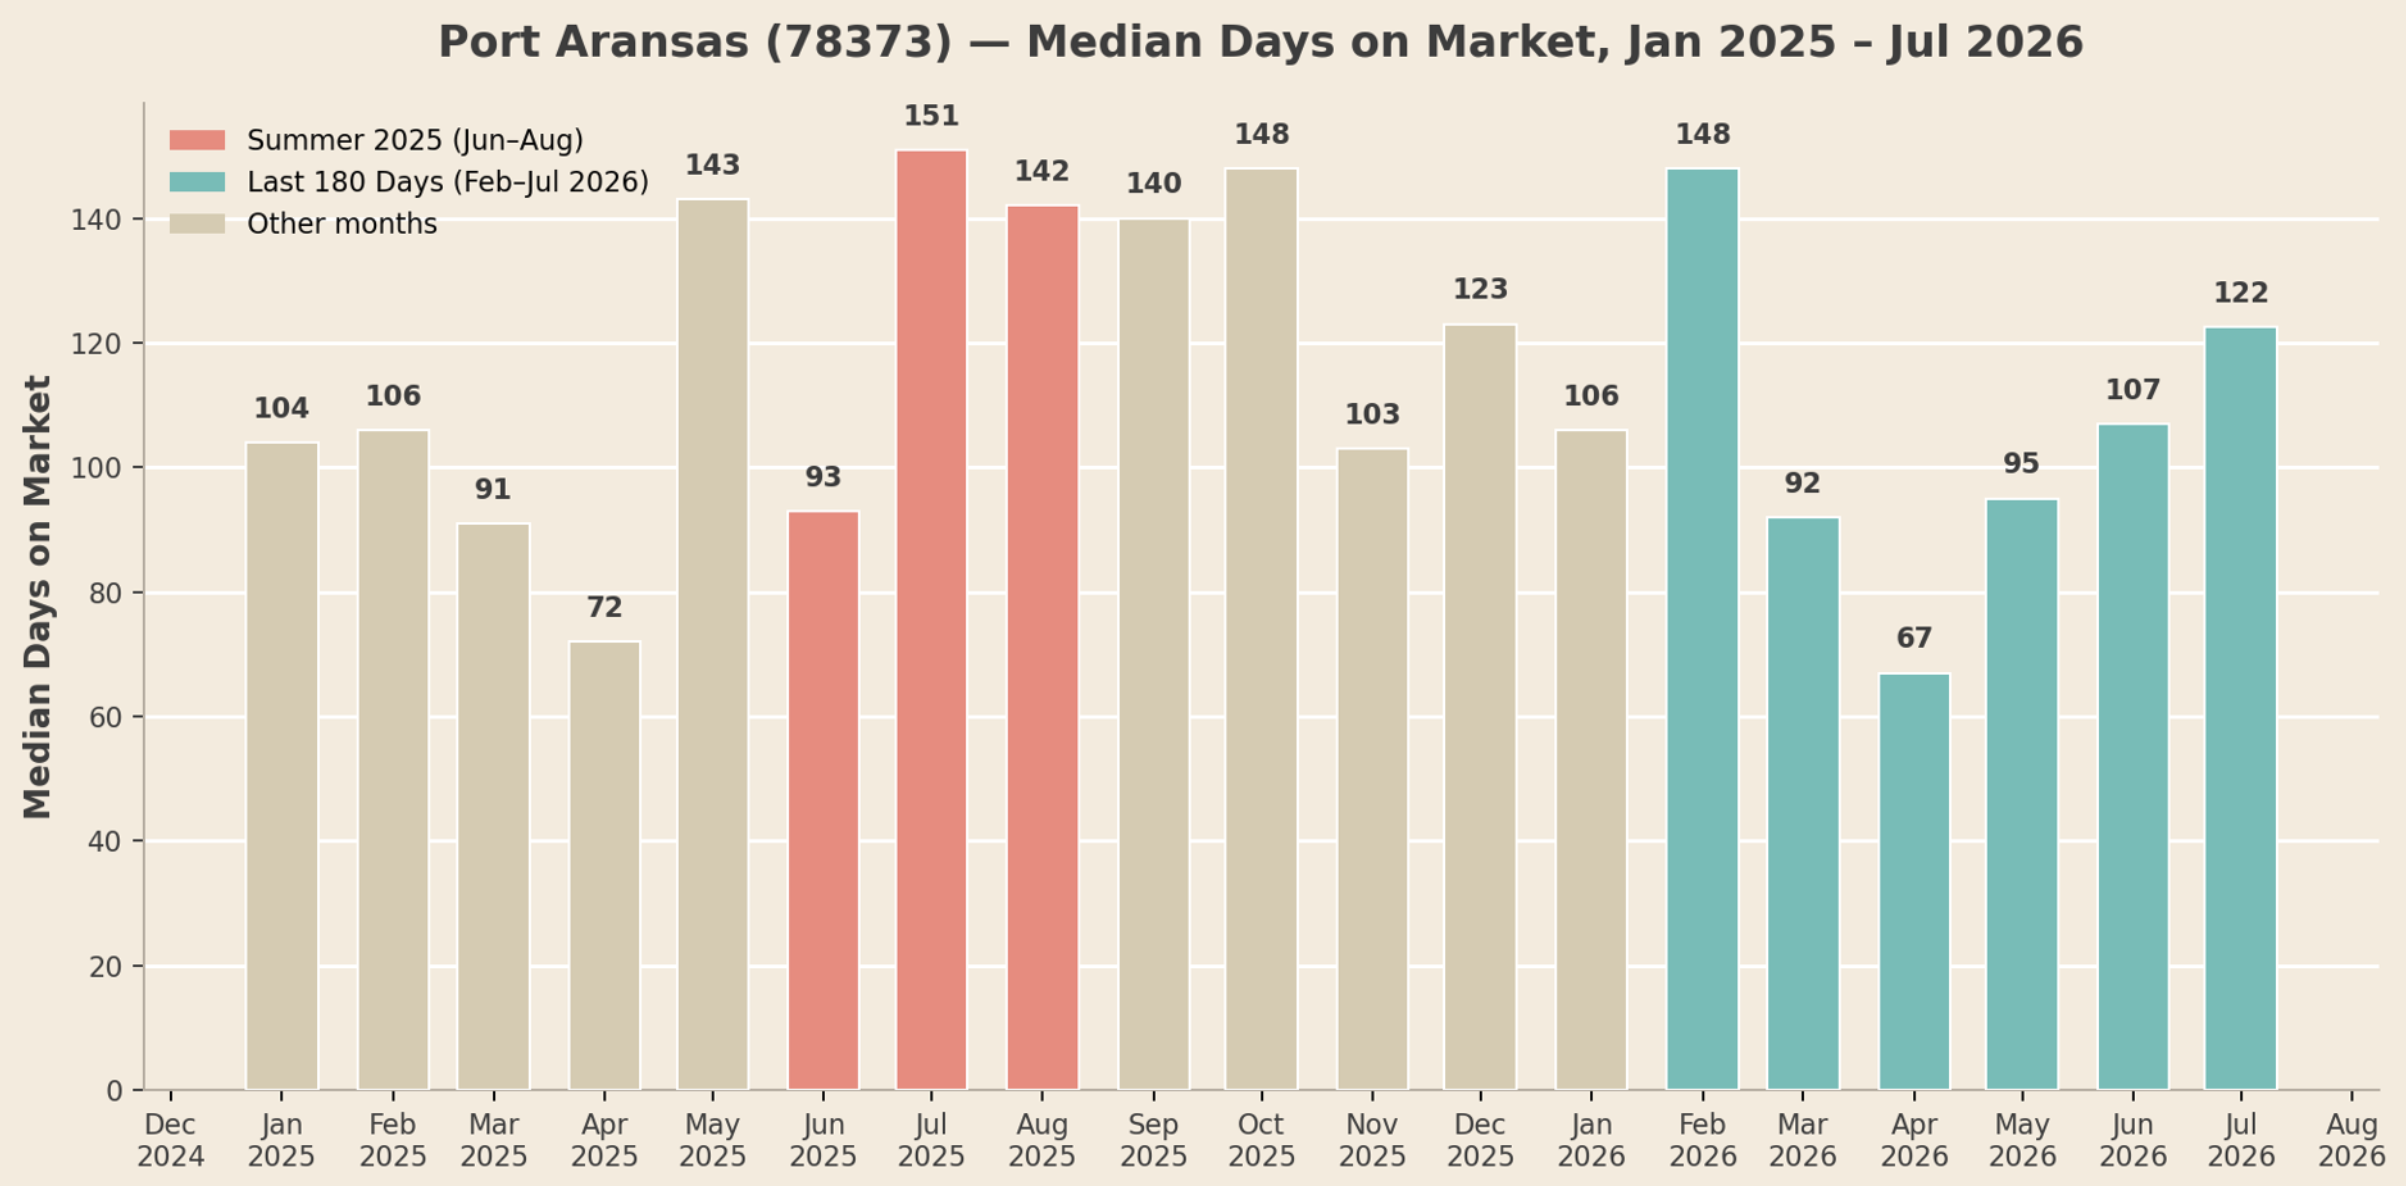
Homes in 78373 are selling about 18% faster than they were in the summer of 2025.

  • Summer 2025 (Jun–Aug): median days on market averaged 129 days — and July alone hit 151 days, the slowest month of the year.

  • Last 180 days (Feb–Jul 2026): median days on market has averaged 105 days, with April 2026 dipping to a brisk 67 days.

Pooling every closed sale from the last six months (186 transactions across the zip code), the median time to sell sits at 97 days — nearly a month faster than a typical summer 2025 listing.


What Changed?

A few things are moving in the same direction at once:

1. Pricing discipline is paying off. Sellers who anchor to real closed comps — not automated valuations — are seeing their homes move in three to four months instead of five. The properties still sitting past 200+ days on market are overwhelmingly the ones that haven't adjusted to where actual sales are landing.

2. Buyers are back, but they're selective. Across the last 180 days, sold properties closed at a median 92.7% of original list price — a healthy number that tells us buyers are engaged and transacting, not just window shopping, when a home is priced to the market.

3. The relist penalty is real. Homes that get pulled and put back on at the same price, hoping for a fresh set of eyes, aren't fooling anyone. Sophisticated buyers and their agents track cumulative days on market. A real price move, updated photography, or a marketing refresh is what actually resets the clock — not a toggle switch.

It's Not Uniform Across the Island

Days on market varies meaningfully by pocket of the market:

Area

Recent Median DOM

Palmilla

~93 days

Cinnamon Shore

~104 days

Port Aransas (general)

~97 days

Island Moorings

~159 days

Palmilla and Cinnamon Shore continue to move quicker than the island-wide average, while some pockets — particularly higher-price, lower-inventory segments like Island Moorings — are still working through a smaller, slower-moving buyer pool.

What This Means If You're Selling This Year

The market rewarding speed right now isn't a fluke — it's a byproduct of sellers pricing to actual recent closings rather than hope. Homes priced within a few percentage points of comparable recent sales are clearing in three months or less. Homes priced aspirationally are still the ones padding out that 200+ day tail.

If your home has been sitting since last summer's slower market, this is a good moment to take a fresh look at where the comps have moved — the ground has shifted underneath your original number, even if the home hasn't changed at all.

What This Means If You're Buying

Inventory is still moving, but not instantly — a 97-day median means well-priced homes aren't lasting the weekend, but they're also not requiring a bidding war to win. There's still room to negotiate on the right property, especially anything that's crossed the 150-day mark, where sellers are increasingly open to a real conversation.


Thinking about buying or selling in Port Aransas, Cinnamon Shore, or Palmilla this year? I track this data monthly across every submarket on the island — reach out and I'll walk you through exactly where your street and price point stand today.